IPMI (Intelligent Platform Management Interface) is a powerful server monitoring protocol specification that every datacentre admin should be familiar with. It can allow one to fully manage a server remotely if they have an Internet/Network connection to the hardware. What are the benefits of this you may ask? Well, you can use IPMI and work on a Server as if you were sitting right in front of it, whereas in reality you could be on the opposite side of the world. With functionality such as remote KVM (keyboard video mouse), hardware monitoring, server health with event logs, virtual drives and much more, IPMI is the staple tool for all Supermicro server admins!
IPMI uses a Baseboard Management Controller (BMC) which is a small chip on the motherboard that is specifically designed to handle server management. The benefit of the BMC is that it is independent from the other resources in the server such as the CPU and has its own network interface so is an Out Of Band management utility.
In this tutorial series, I will start with the basics of the BMC setup using Supermicro’s implementation of IPMI. In later articles I will explore more advanced options such as command line server management, firmware upgrades, RAID management and more…
IPMI setup
Once you’ve taken delivery of your shiny new server, it is wise to configure IPMI before deploying the hardware in a datacentre or any other location where it will be in production. This means you should set it up once you take delivery or request the IP details to be set up prior to receiving the server. This is something that our engineers can configure here at Boston, for example. Alternatively, if the server already has an Operating System installed and you have remote access, then IPMI can also be configured after deployment from within the OS.
It would also be worth getting the IPMI unique password from the server motherboard or ID tag now. But more about passwords later.
First things first, IPMI needs a network connection. For security best practises, it is recommended to use a non-internet facing connection for IPMI to isolate this traffic internally only. Most servers have either a dedicated IPMI LAN port or a shared IPMI and regular LAN port. The shared one has two MAC addresses to route the traffic, to allow both IPMI and the regular LAN ports to independently communicate on the network.
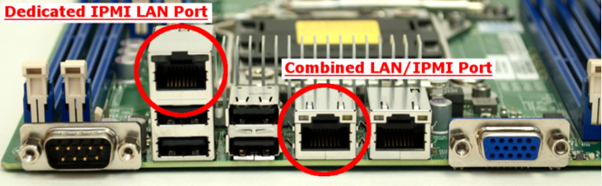
Dedicated IPMI port and shared LAN/IPMI
By default, IPMI uses DHCP (Dynamic Host Configuration Protocol) so an address should be assigned by the DHCP server if one is present on the network. Having a static IP address is one of the first things you should do to prevent the address changing resulting in a loss of access, I will explain how to do this further below.
Once you plug a LAN cable into the IPMI port you can power the server on and look out for the IPMI address, this will show on the bottom right corner during POST (if a DHCP is present).

BMC IP address appears in the bottom right during POST
Alternatively, you can press the DEL key during POST to enter the BIOS and then navigate to IPMI > BMC Network Configuration. Here you can see the IP address as well as configure the settings such as a static IP address and gateway. In the below example we have set a Static IP by choosing 'Update IPMI LAN Configuration' and changing the IP, Subnet Mask and Gateway. After saving and rebooting the new address will be applied.
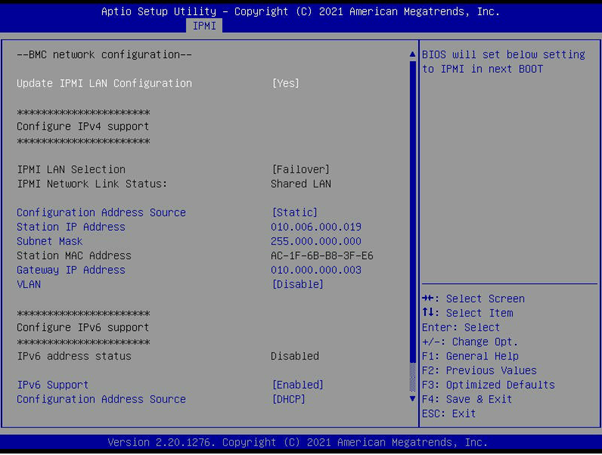
IP address located in 'IPMI > BMC Network Configuration' in the BIOS
At this stage the whole server is ready for you to control remotely!
Connecting to the server
There are numerous ways to connect to the BMC interface. Simple options are web interfaces and other GUI based software, to more advanced command line based (CLI) using various Supermicro IPMI tools. In Part 1 of this series, we will look at Supermicro’s IPMI Web Interface.
For many years Supermicro have been using a web GUI that is rather dated by today’s standards. Recently, they have upgraded the platform significantly and now use the OpenBMC standard. This is a newer, open-source BMC that is easier to develop and add features for. Not only that, it is a more secure platform compared with the previous closed BMC which has seen several security issues in the past. As you can understand, security is a critical concern when it comes to a chip that can allow access to pretty much an entire server for a remote user.
Alongside the upgrade to OpenBMC, Supermicro have introduced a new web interface which is much nicer looking and easier to navigate. The updated GUI is used in some of the newer Supermicro servers using the X12 and H12 (Intel Xeon Scalable and AMD EPYC) platforms. This is the GUI we will be looking at today.
If you are on the same or a routable network to that which the BMC is connected to, you can simply open a web browser and type in the IP address and you will be presented with the screen below.

IPMI login screen
By default, the password is ADMIN/ADMIN, however in recent years this has changed to a more secure unique password. The unique password means that if you do not secure your server with your own password then it is less likely for an attacker to randomly guess and gain access to the system. This can be located on the pull-out server tag, usually located on the front of the server. It is also printed on the motherboard on a sticker with a barcode.
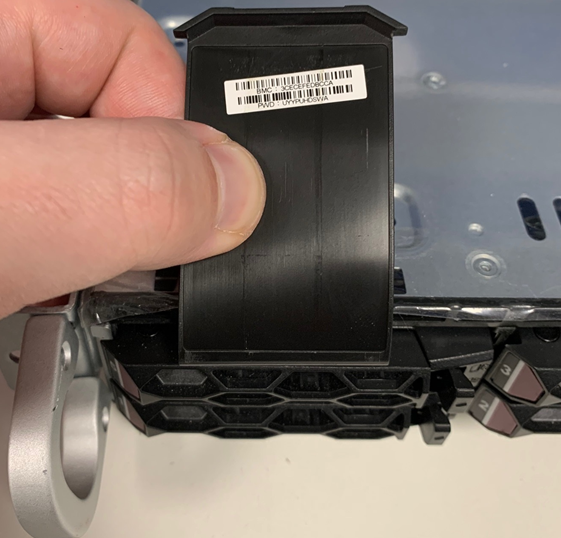
Server service tag showing BMC MAC address and unique password
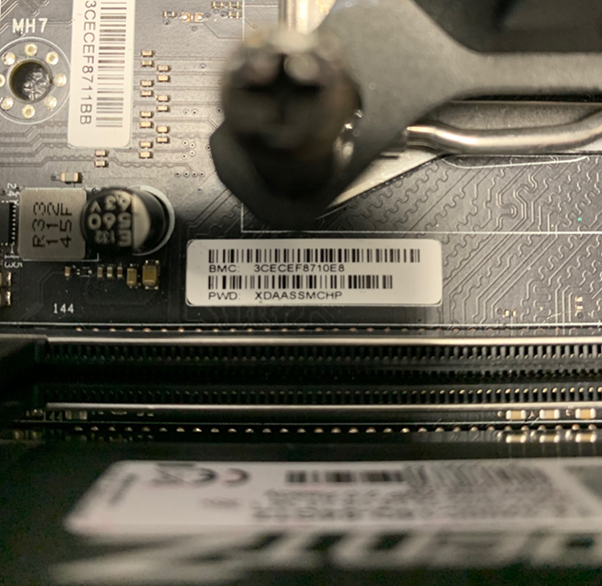
IPMI MAC address and unique password printed on the Motherboard
The Web GUI
Once logged in, the start page is the Dashboard which provides a summary status of the server and quick access to some useful features. These links are along the top of the screen and take you to further sections; System, Storage, UID control, Firmware Update and Sensor Readings.
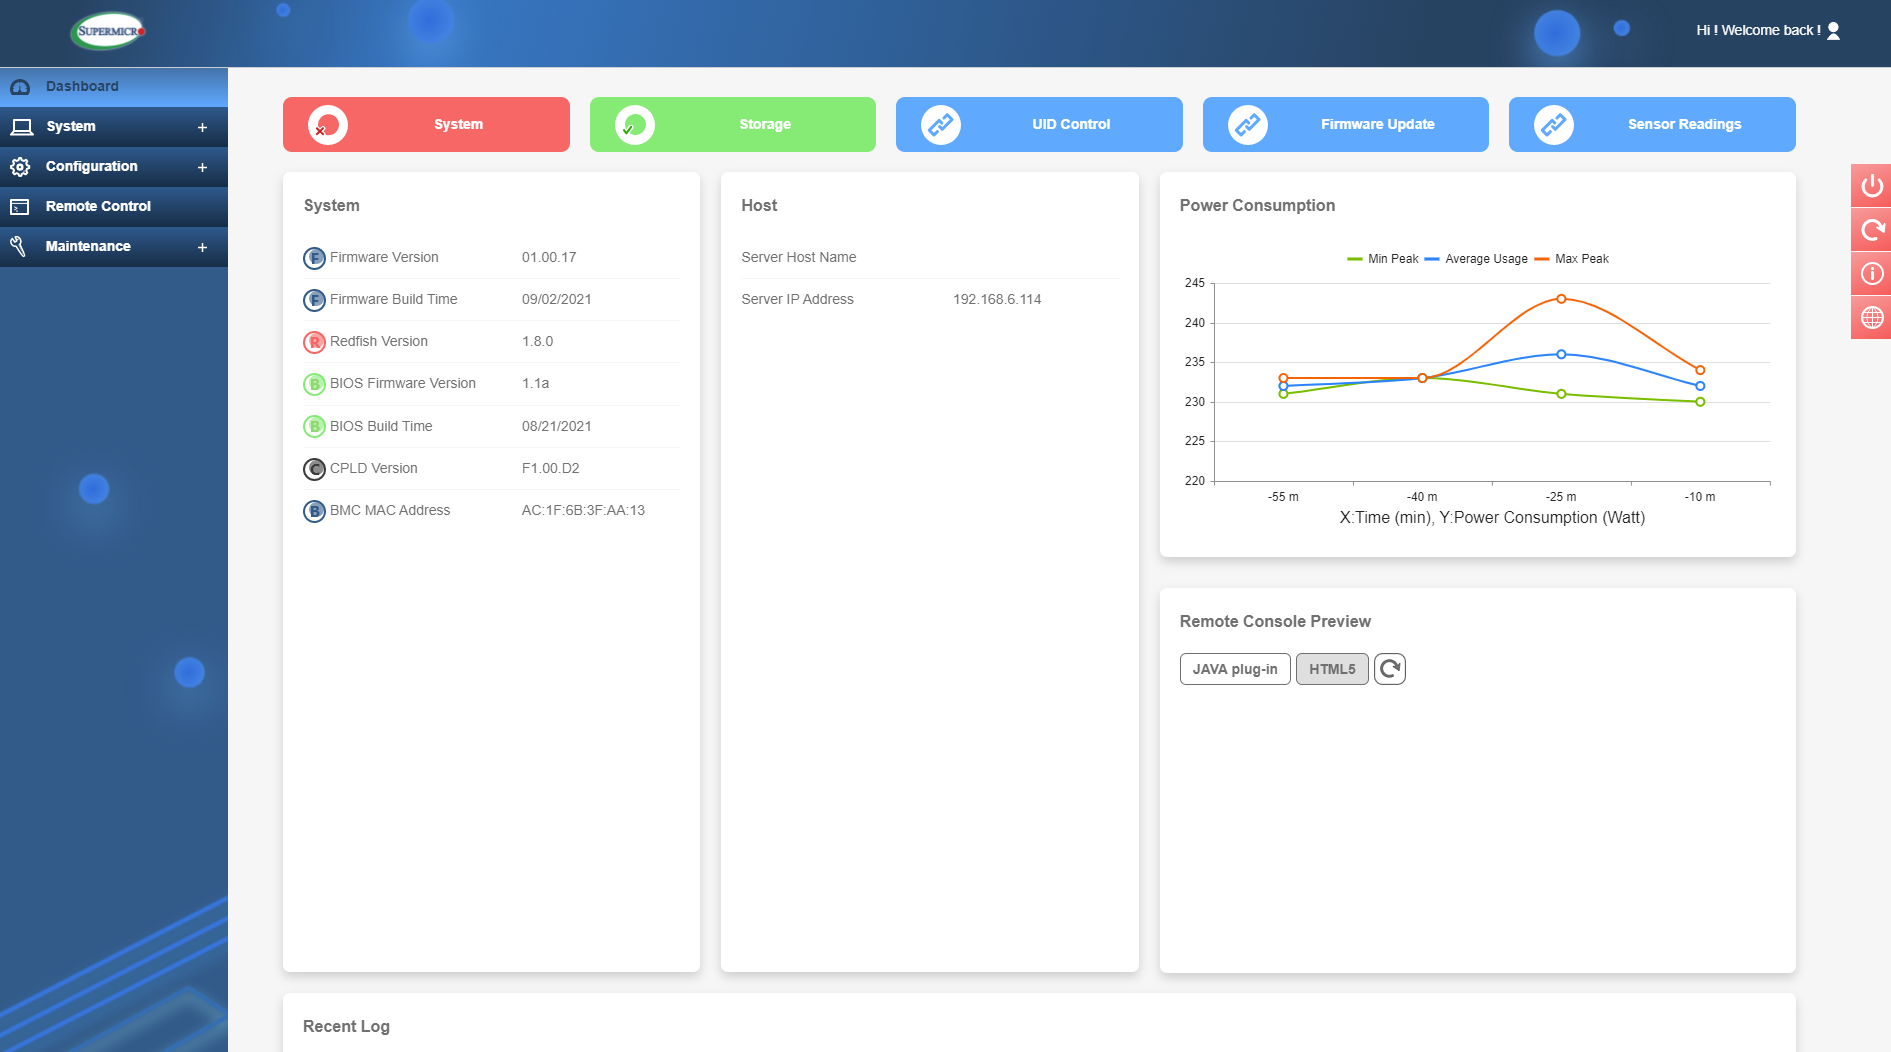
The Dashboard
Just in the Dashboard, however, you have info such as BIOS and IPMI firmware revisions, IP and MAC addresses and Host name info. Also on this page is a summary and graph of recent power consumption and recent event logs. There is also a quick access here to launch the Remote Console and see a small preview of what’s currently on-screen. This will give you KVM (keyboard/video/mouse) control of the server (more on this later). The option here is to use Java or the newer HTML5. In my opinion HTML5 is faster to launch and offers a much smoother experience, as well as having no need to install Java onto your local machine – something many IT professionals prefer not to do.
The previously mentioned shortcuts at the top of the dashboard will take you to relevant sub sections of the GUI. The full list of these sub sections can be seen on the left side of the screen so we will look at those next.
System
In the System section, the first subcategory is 'Component Info'. Within this, we can see a lot of useful info about the server. The Overview has useful inventory management info such as product codes, asset tags and serial numbers, etc.
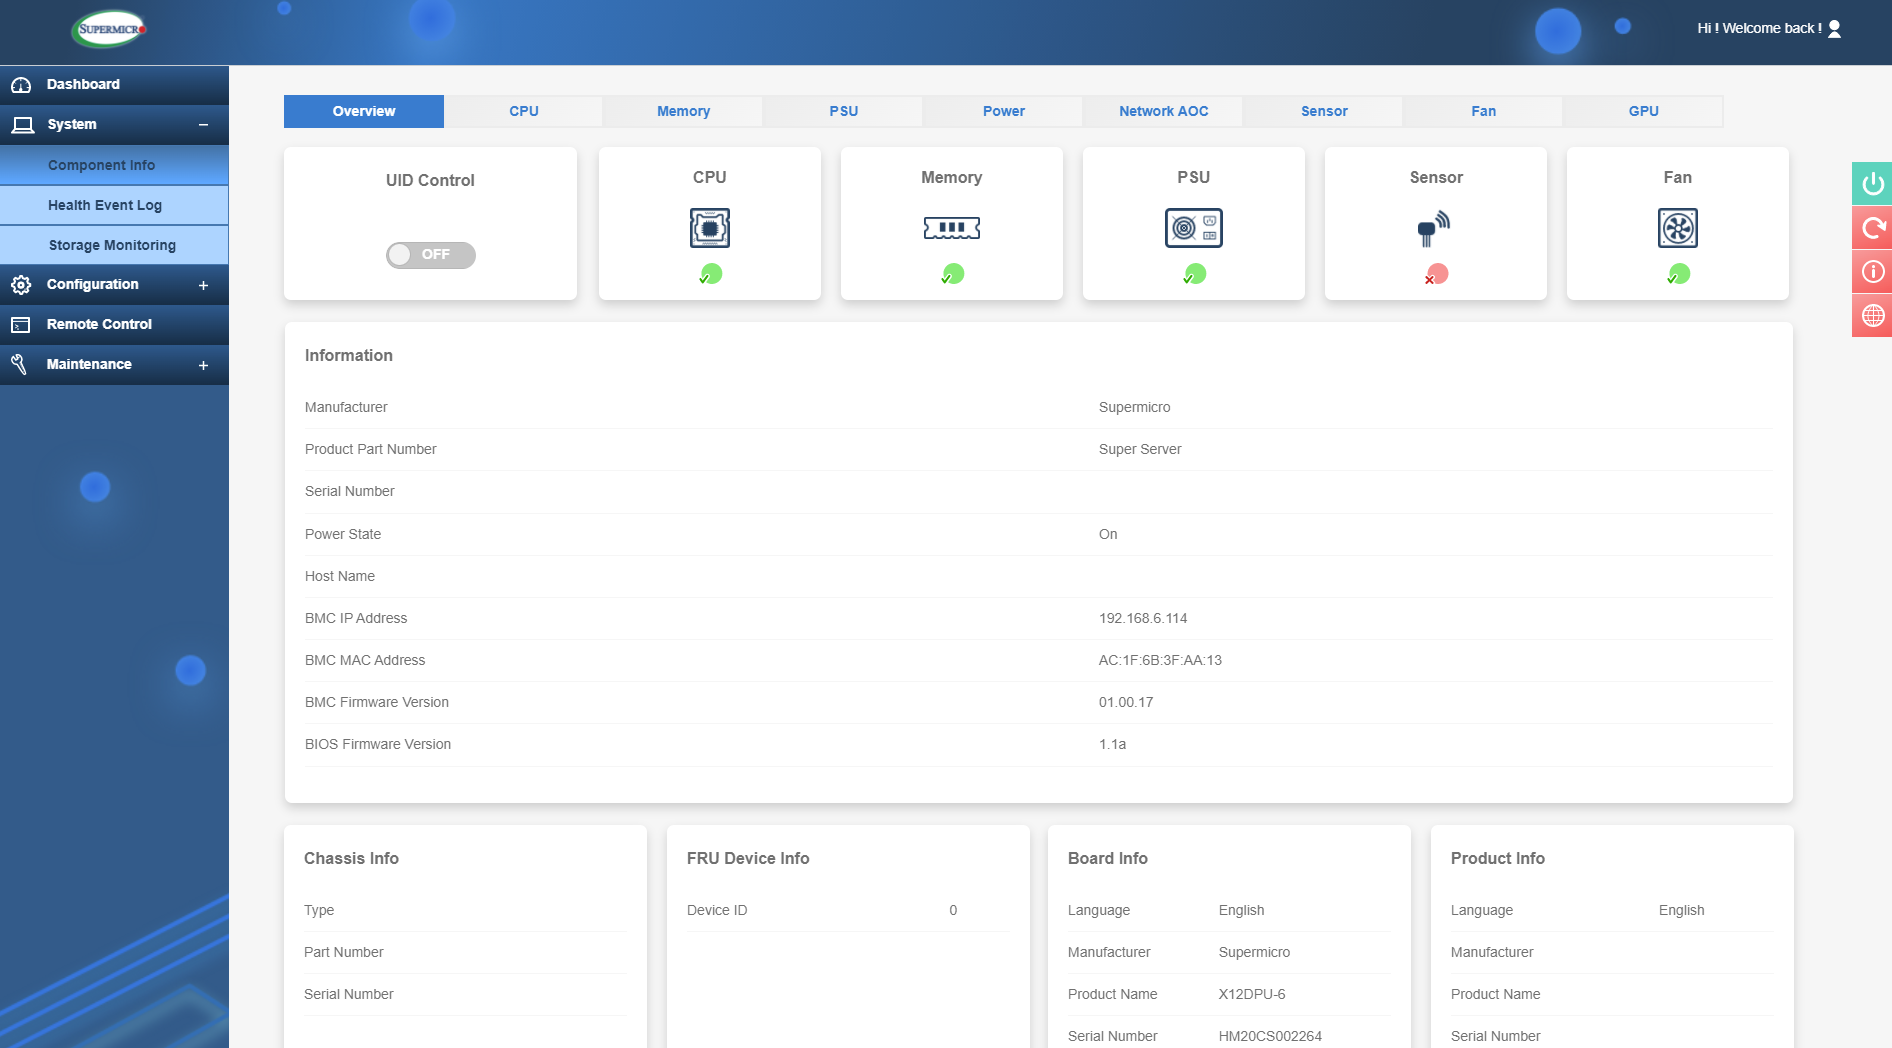
System Overview
Also, along the top here you can see various component categories so you can quickly check if any component is reporting an issue or requires maintenance - this is shown as a green or red tick. For example, if you had a failed memory module then the memory icon would have a red tick and clicking on this icon would show you which specific module has failed.
For all categories here, you can view components installed such as CPU’s, power supplies, network cards, and graphics cards. Each of these will report if an issue is present. In the fan section you can check fan status and speeds and set the mode which can be:
- Standard – Provide standard fan speed
- Full Speed – Maximum cooling
- Optimal – Balanced fan speed and power consumption based on sensed component temperature
- Heavy I/O – Boost cooling to the add-on card zone

Fan control
Other items of note are the power readings. This is useful to see how much power is being drawn as well as historical data.
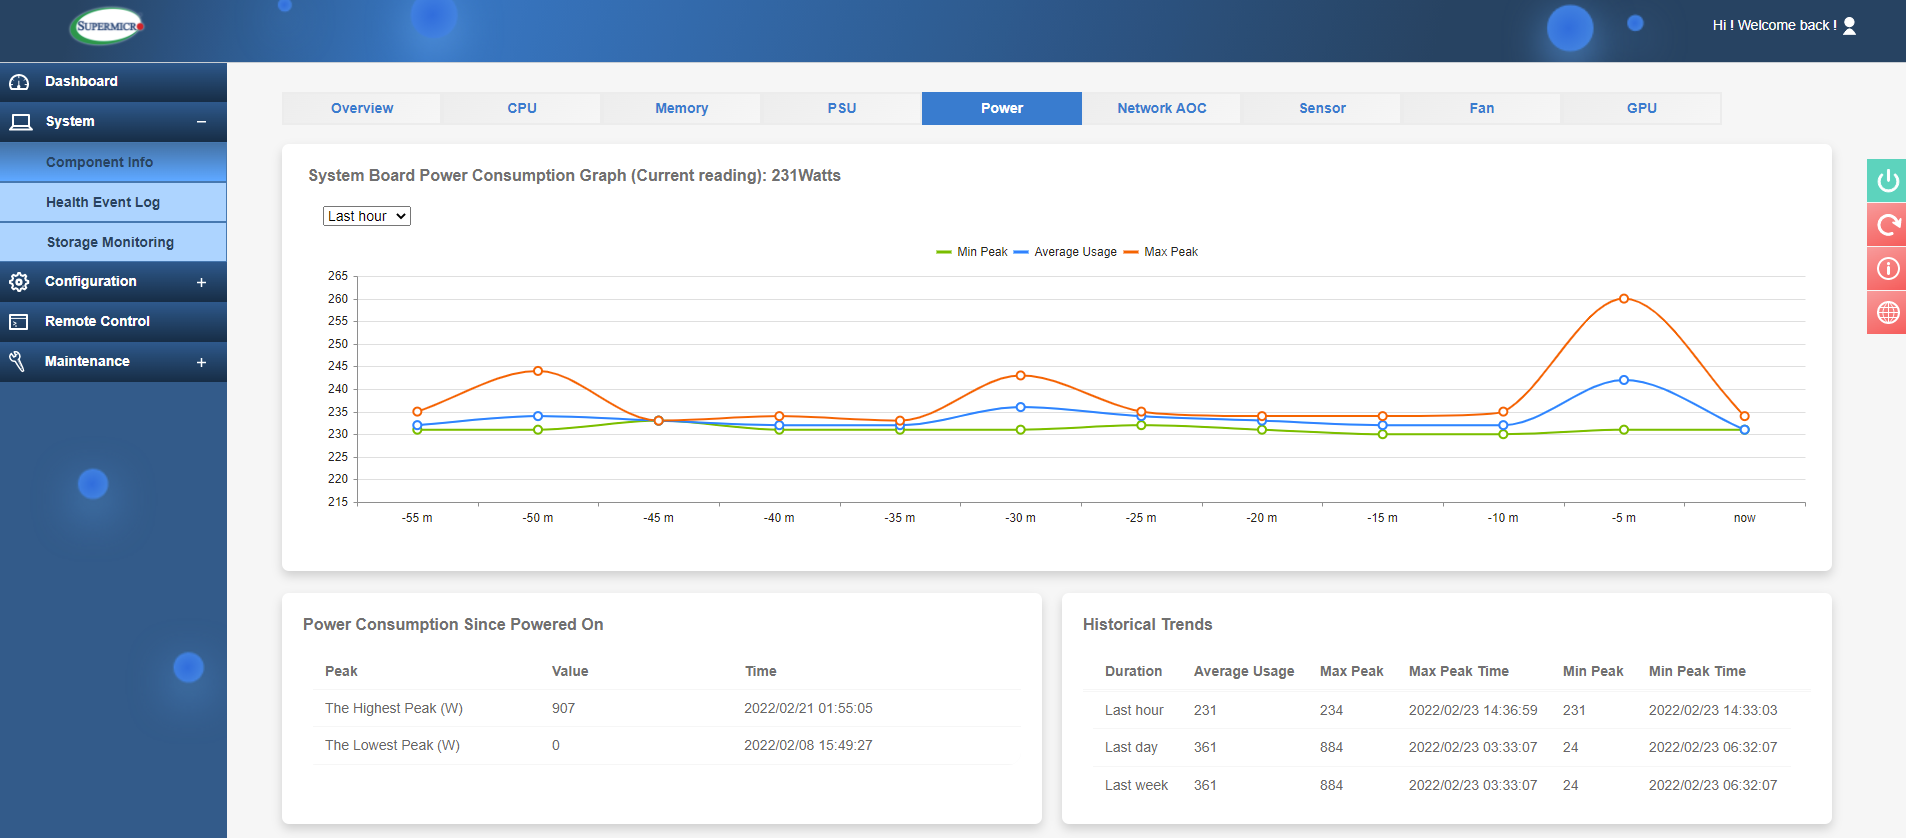
IPMI power data
The Sensor section is a vital IPMI tool for monitoring your server, this will show a host of temperatures for the CPU’s, memory, NIC and SSD among others. Voltages will also be shown and other component statuses such as fan speeds, power supply status and more. So, this is a very useful tool to get an overview of system health.
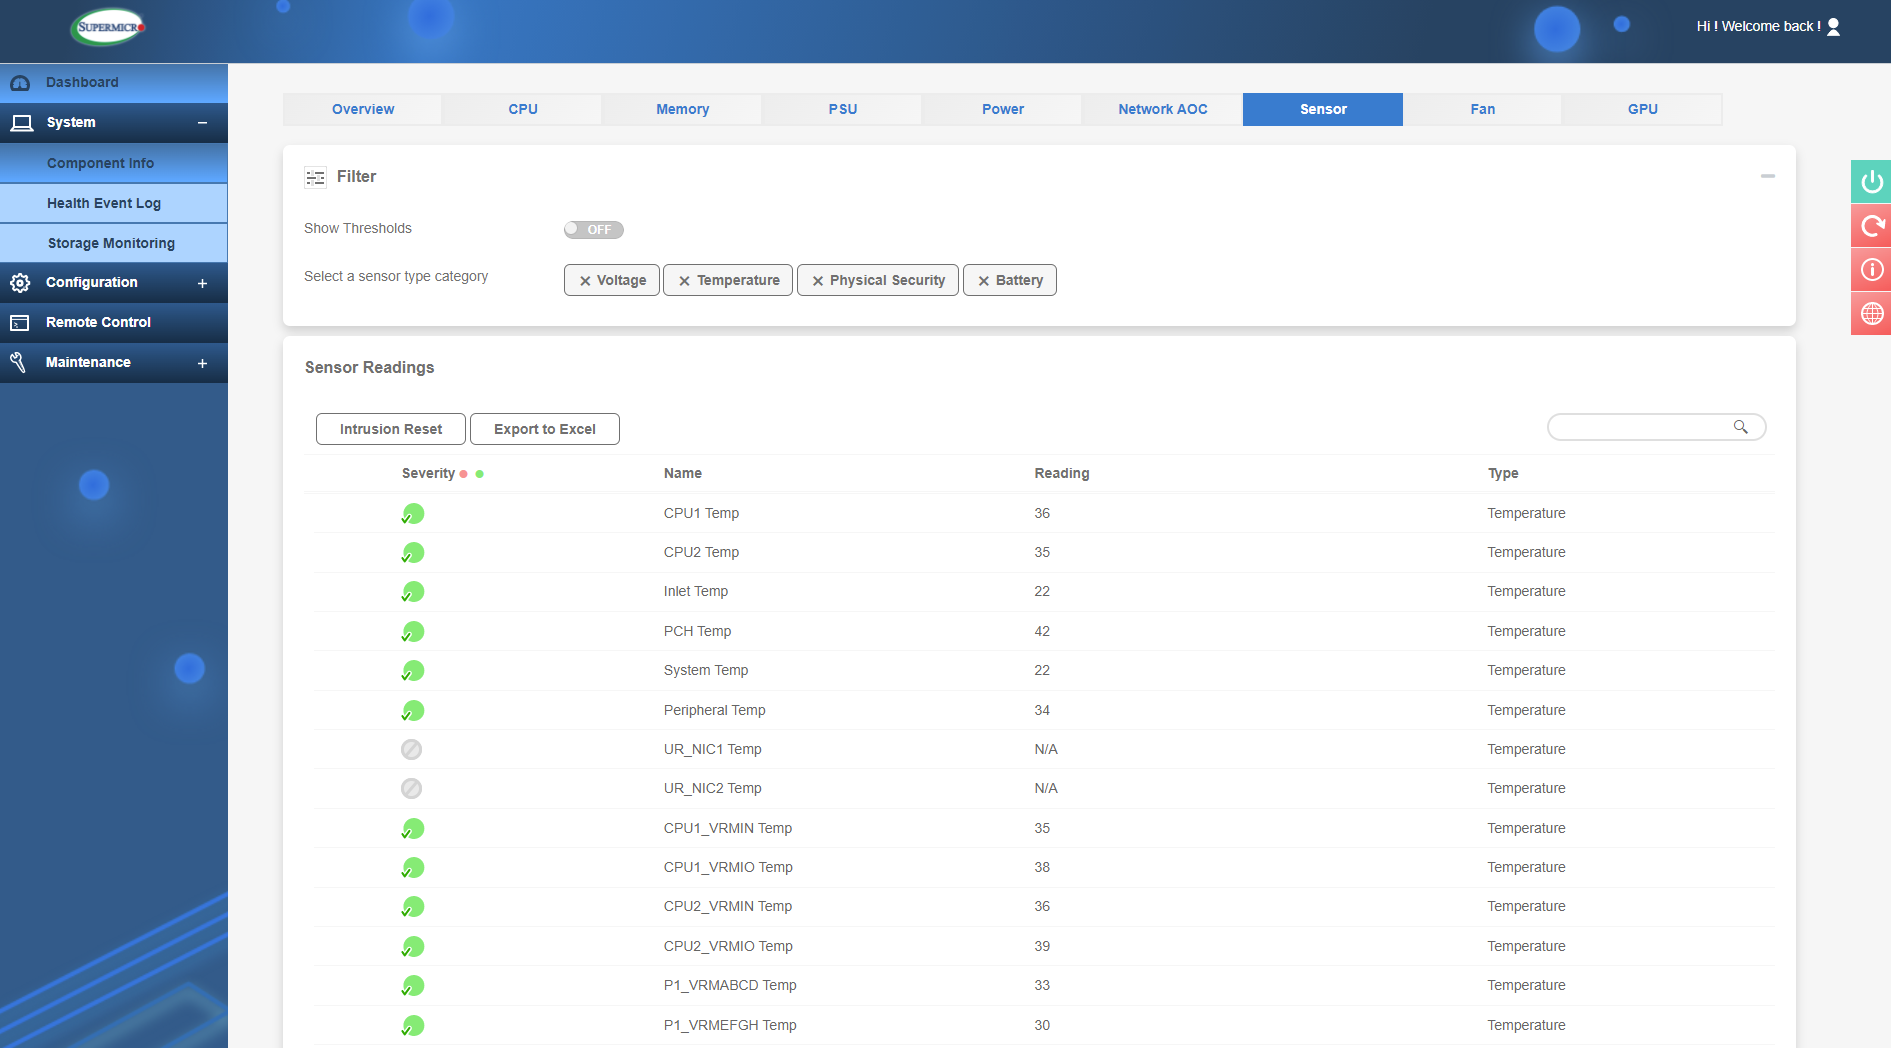
Sensor readings
The next section is the 'Health Event Log'. This will show events ranging from simple stuff like an OS booting, a disk drive being removed or chassis intrusion (security). Other events which are of much more use are component failures. You may get an event for a fan failure or faulty memory DIMM. The event will also state which exact component has failed (e.g. PS1 for Power Supply 1 in a server that has 2 PSU’s) so this greatly helps when parts need to be removed for RMA purposes.
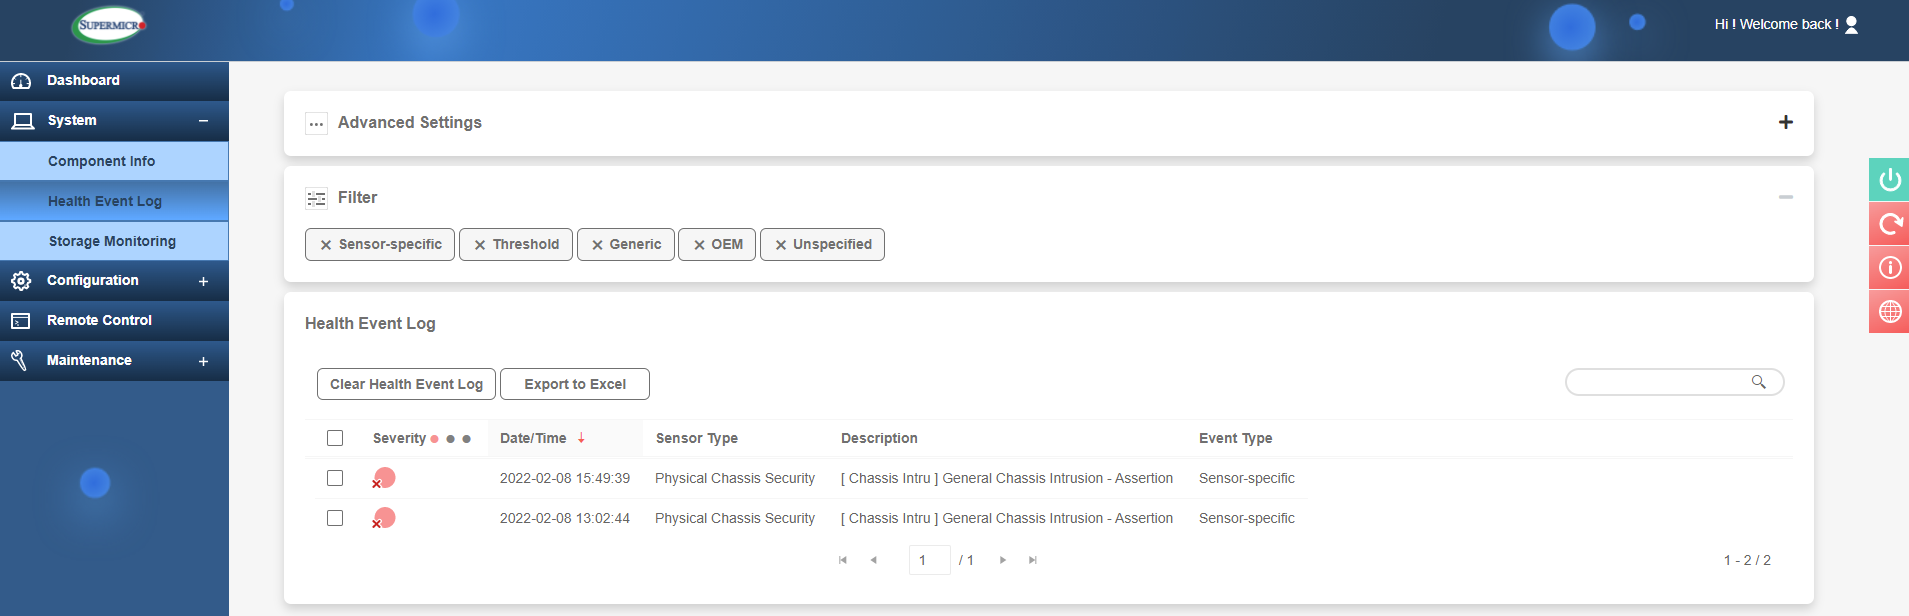
Power supply failure example
The events range in severity from red (critical alert) to green (general info).
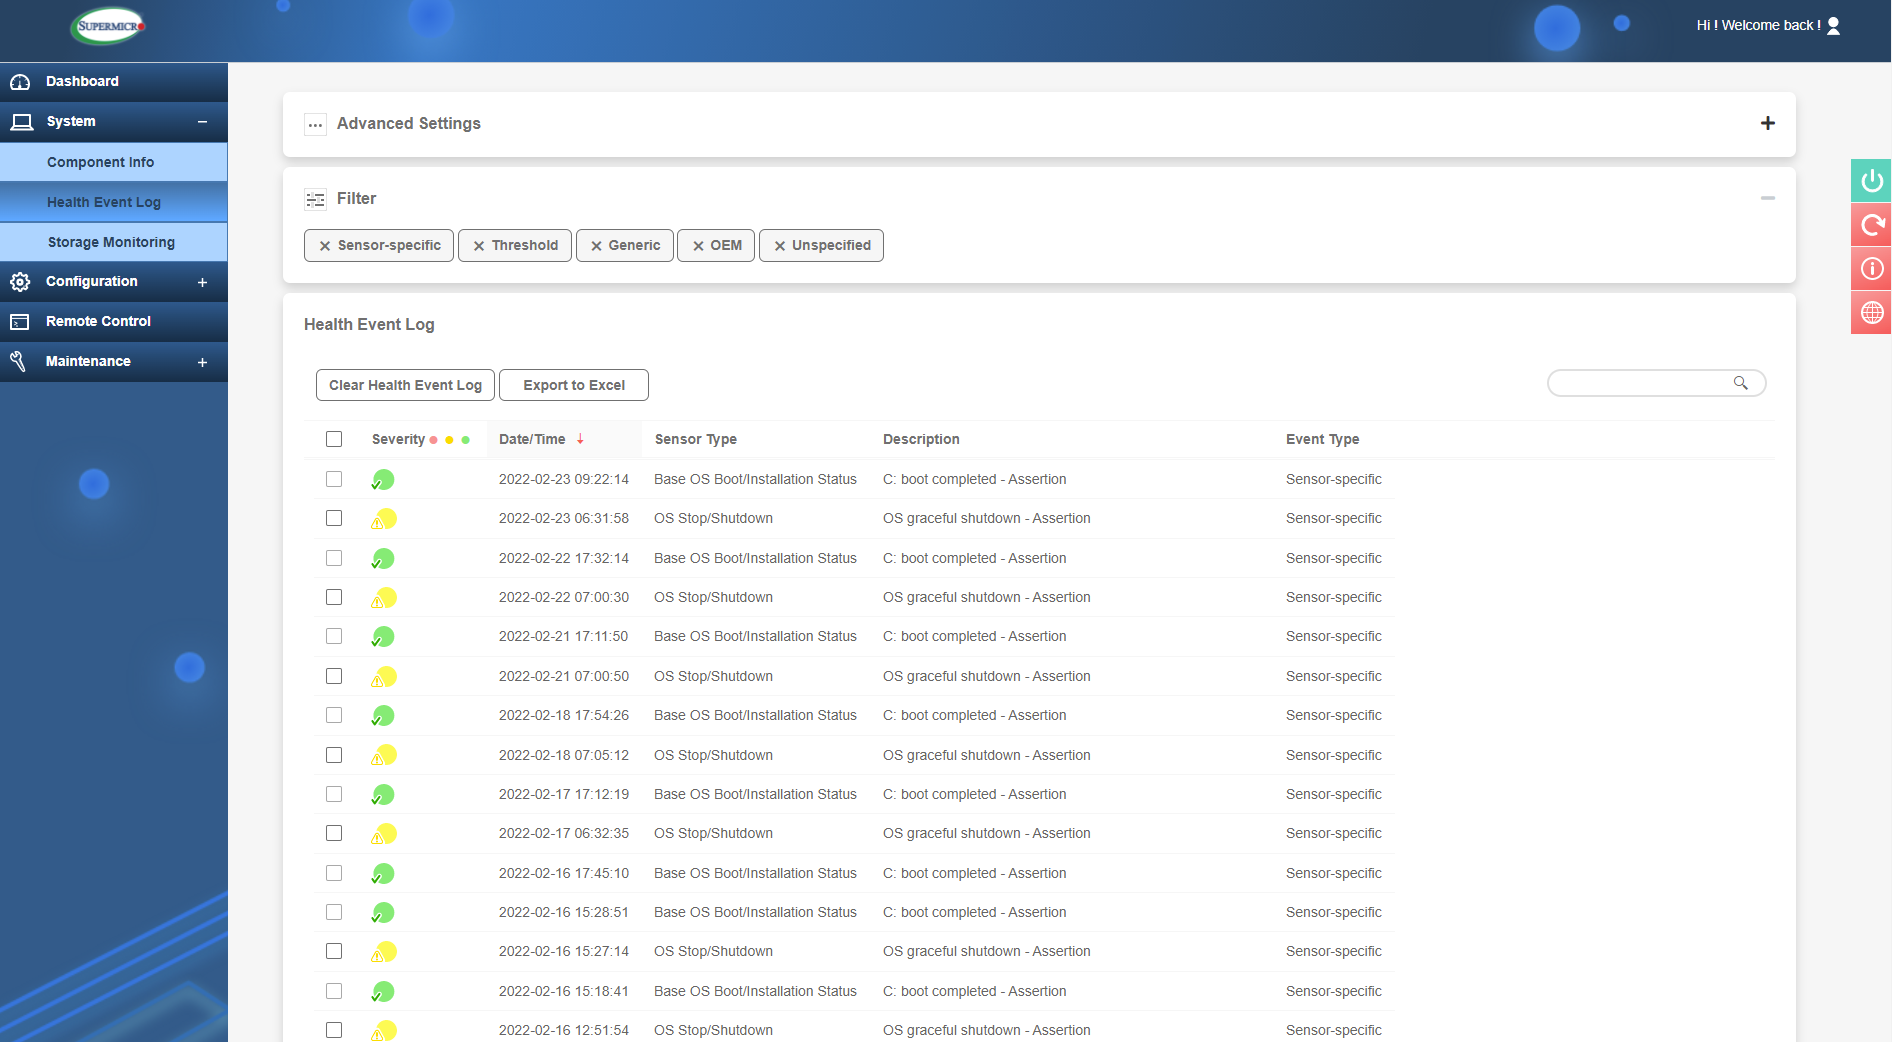
Health Event Log
Finally, the System section also contains 'Storage Monitoring'. Quite a useful section here, where you can monitor drives such as HDD’s, SSD’s and even NVMe drives. You can get an overall overview of the health status as well as physical and logical views of storage media. The logical views will show once you have some RAID volumes created. Finally in the 'Controller View', you can view and manage the dedicated hardware RAID controller including creating RAID volumes and managing firmware. We will look at these features in closer details in a future module.
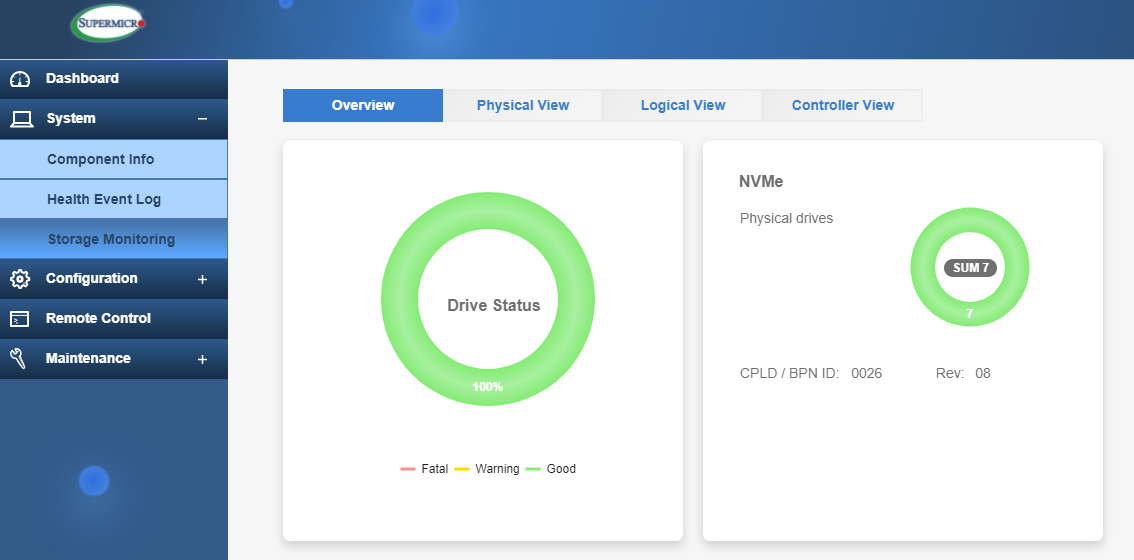
Storage Monitoring Overview
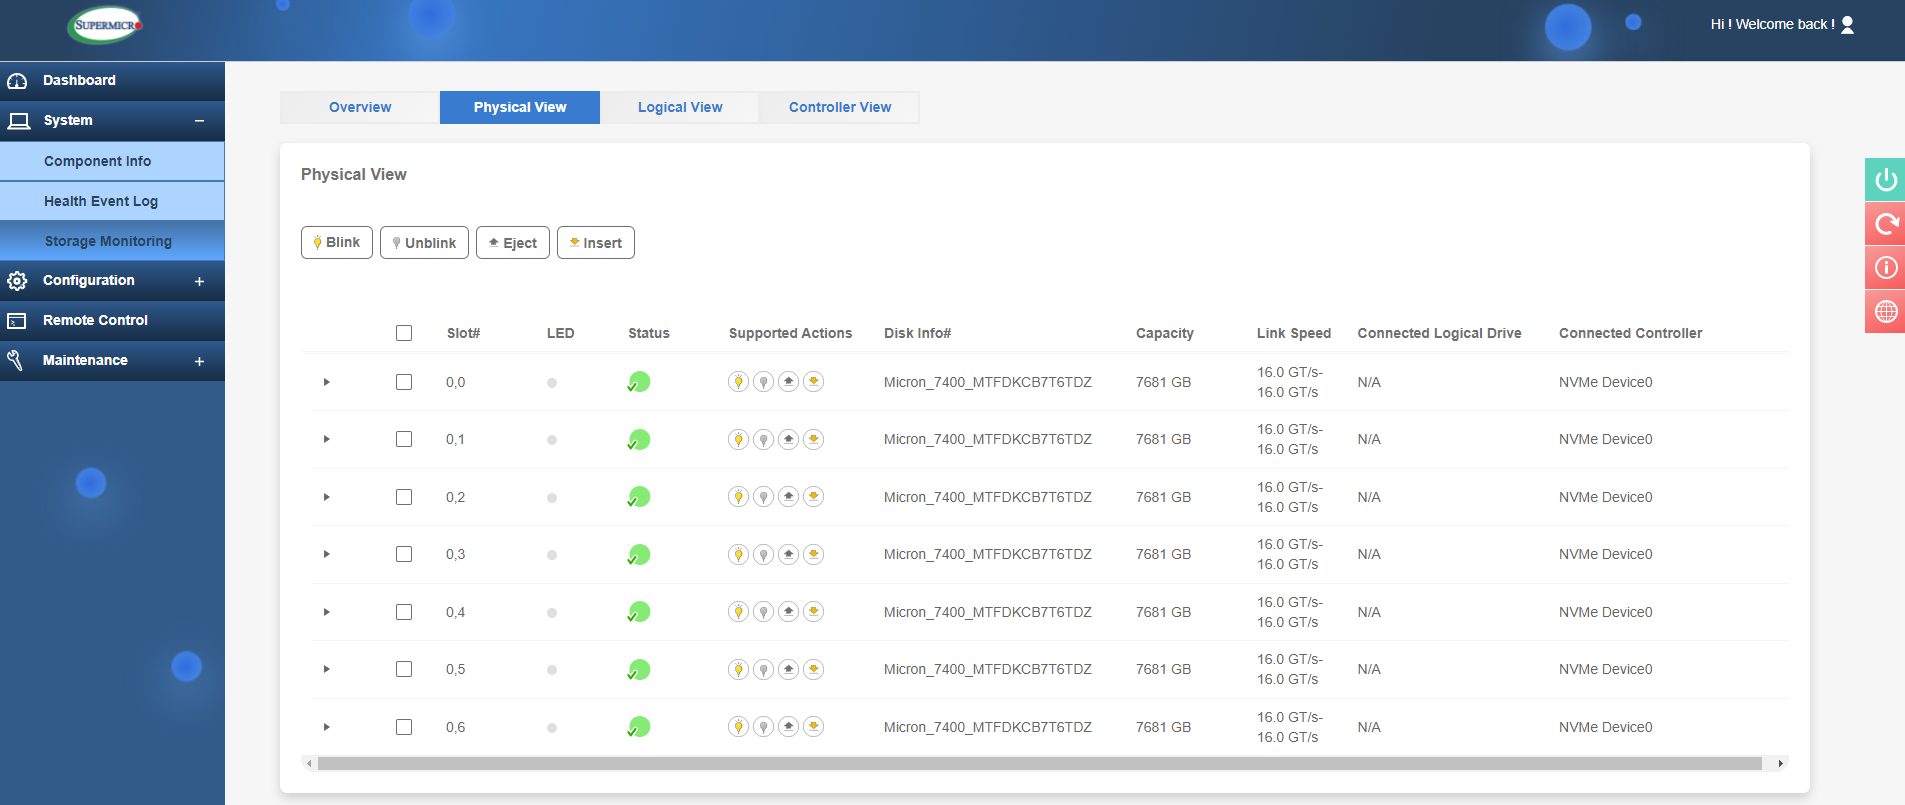
Storage Monitoring Physical View
Configuration
The Configuration tab is one of the next main sections. This section is related to the various settings that can be configured in IPMI.
In 'Account Services' you can create users with admin or lower privileges and create 'lockout' rules for failed login attempts.
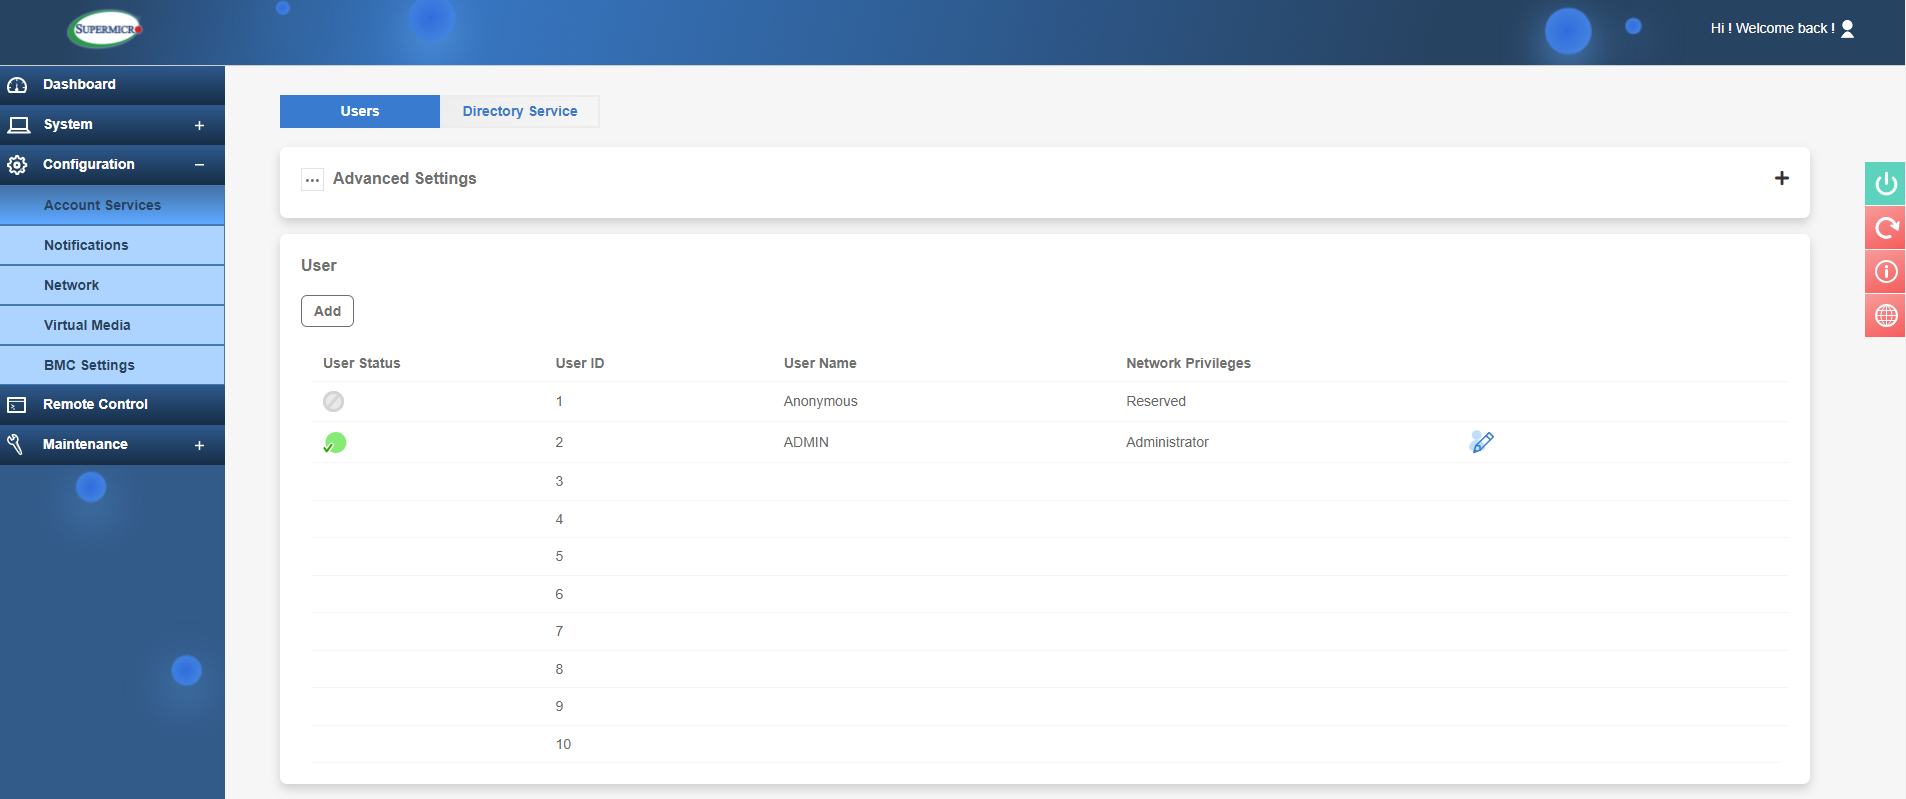
IPMI User and Login Control
'Under Directory Service' is where more refined access control exits. Here you can link to an Active Directory service and configure LDAP and RADIUS authentication protocols.
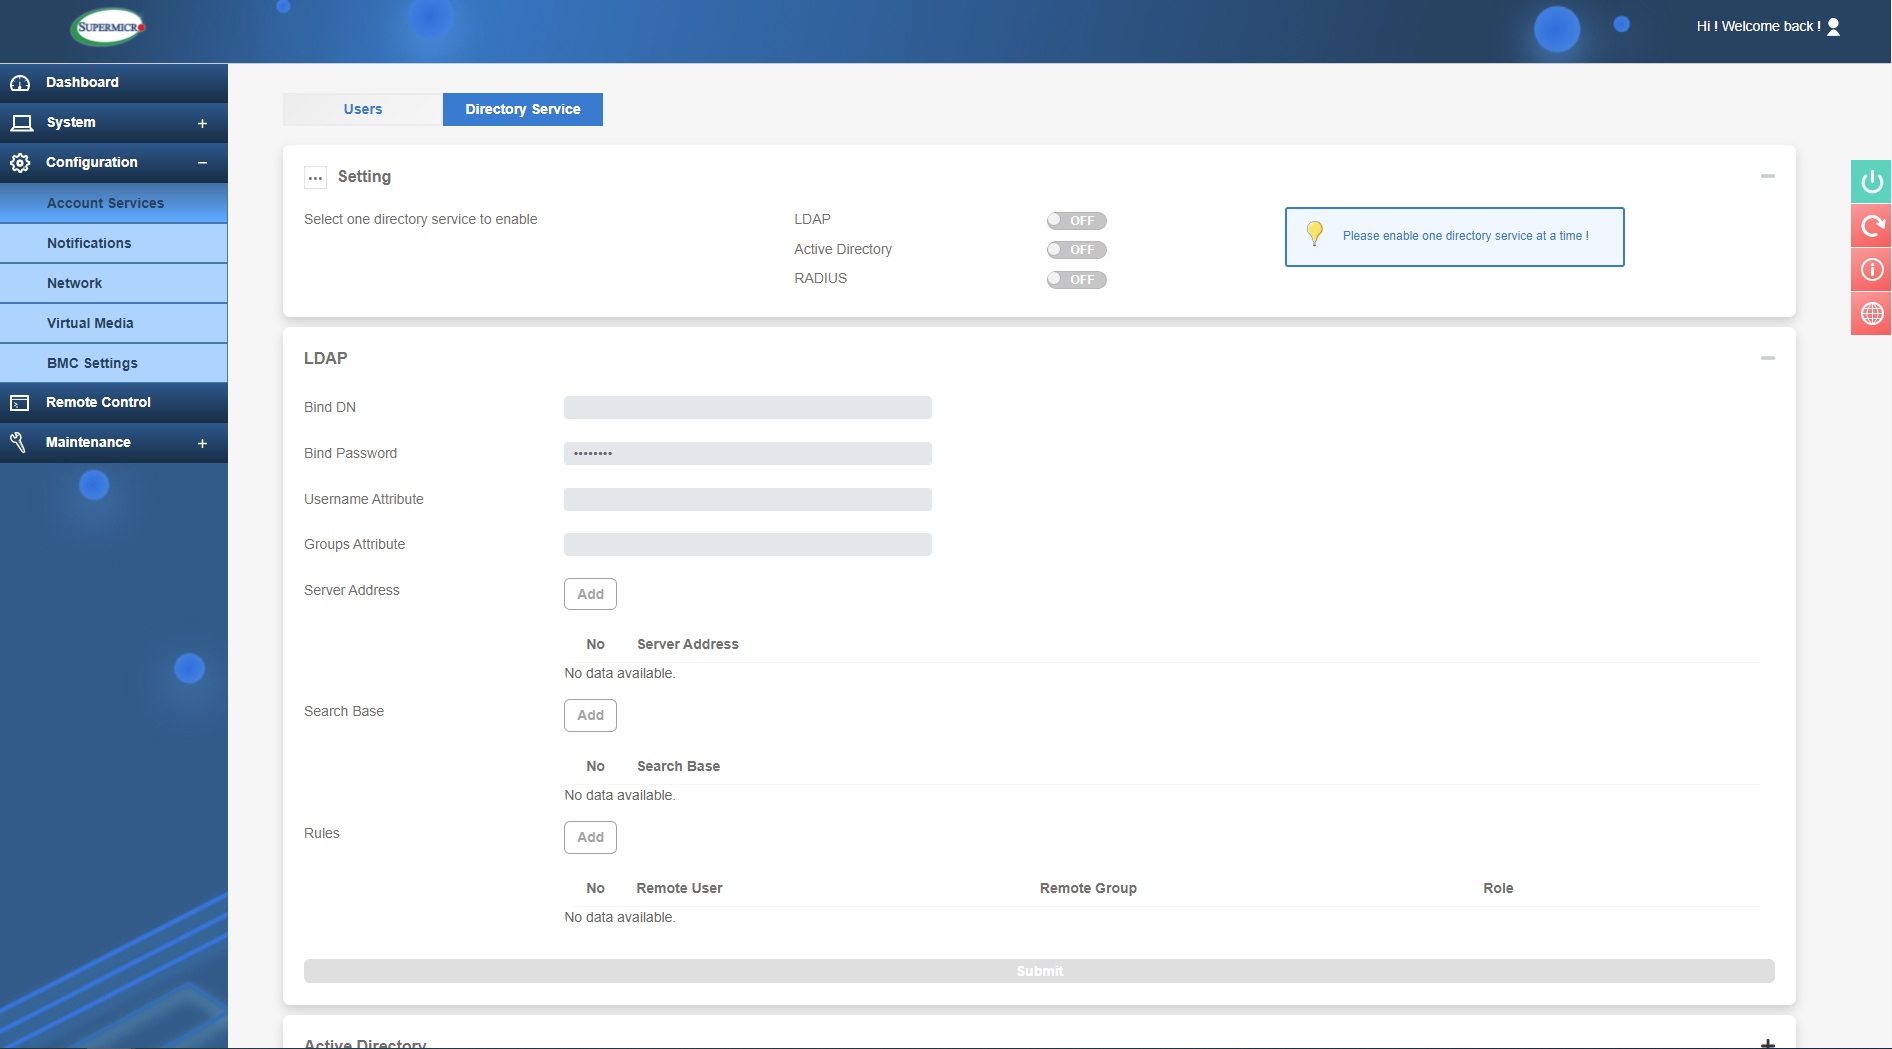
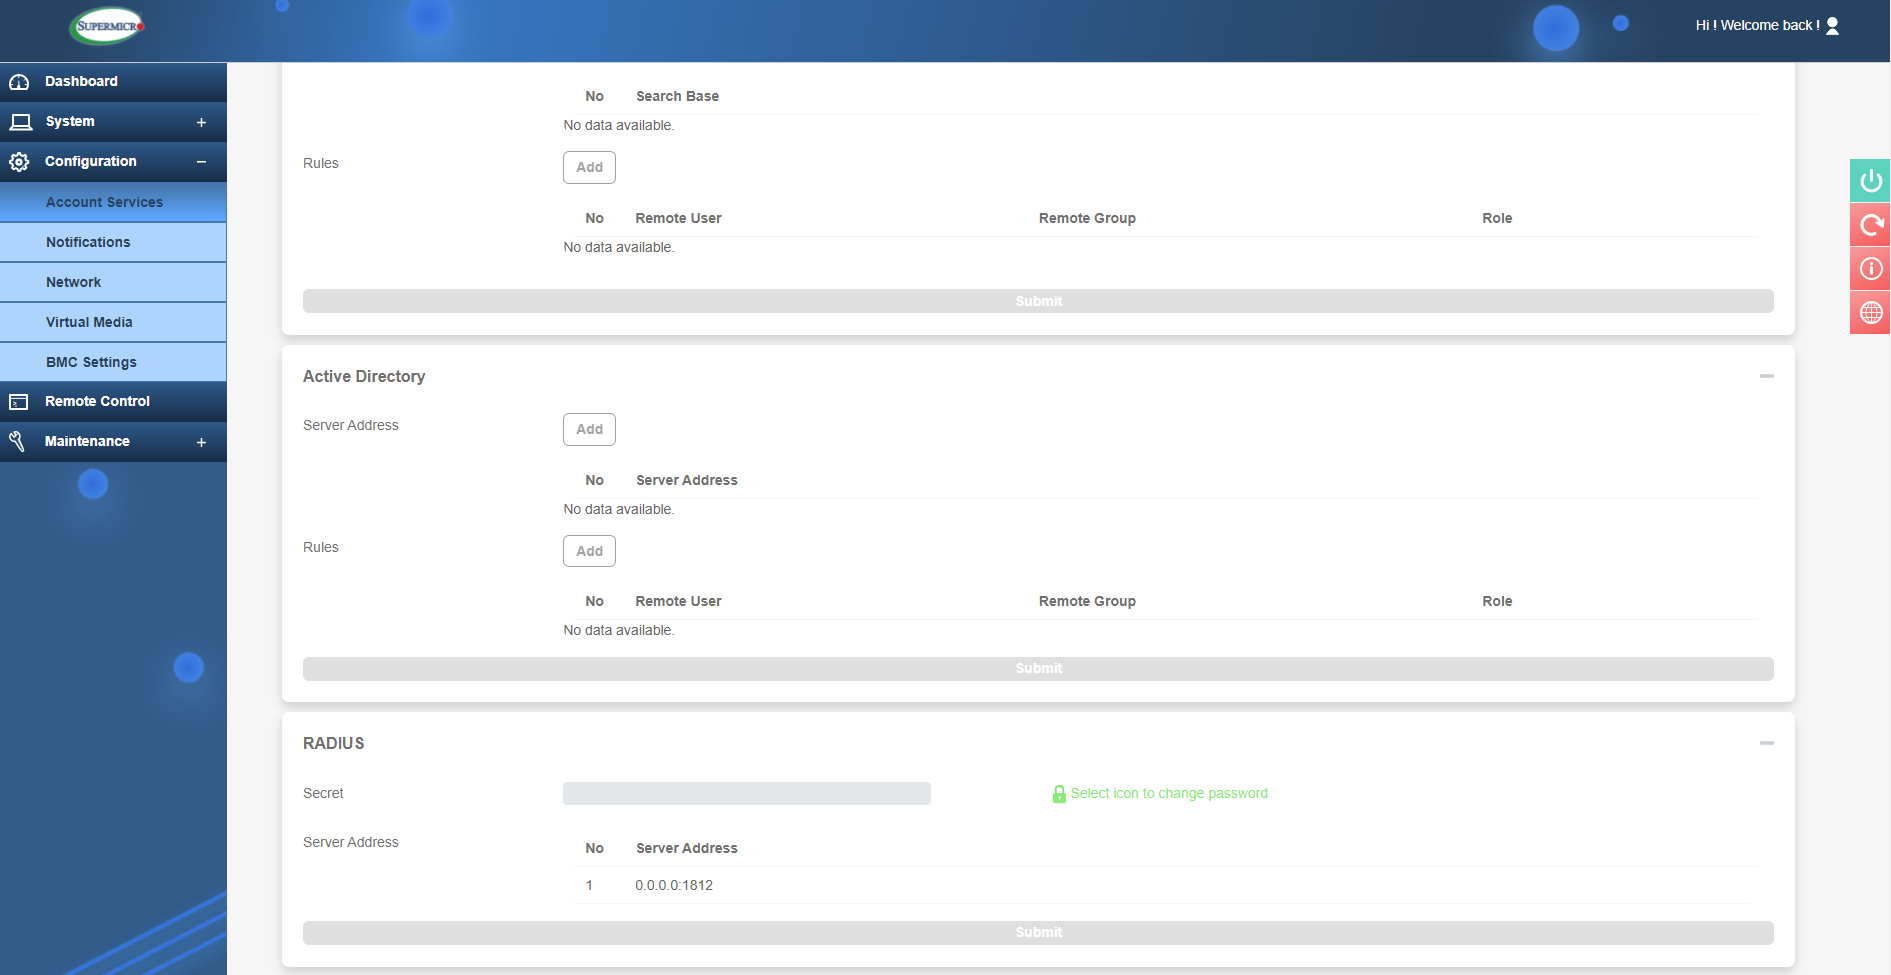
LDAP, Active Directory and RADIUS configuration
Other powerful monitoring features of IPMI can be configured in the Notifications section. This allows admins to configure alerts that can send information about certain events such as server status, components failures or IPMI access attempts, to name just a couple of examples. These can use the Redfish protocol, SNMP traps with a receiving server able to receive the alerts or it can be configured with SMTP to receive email alerts instead.
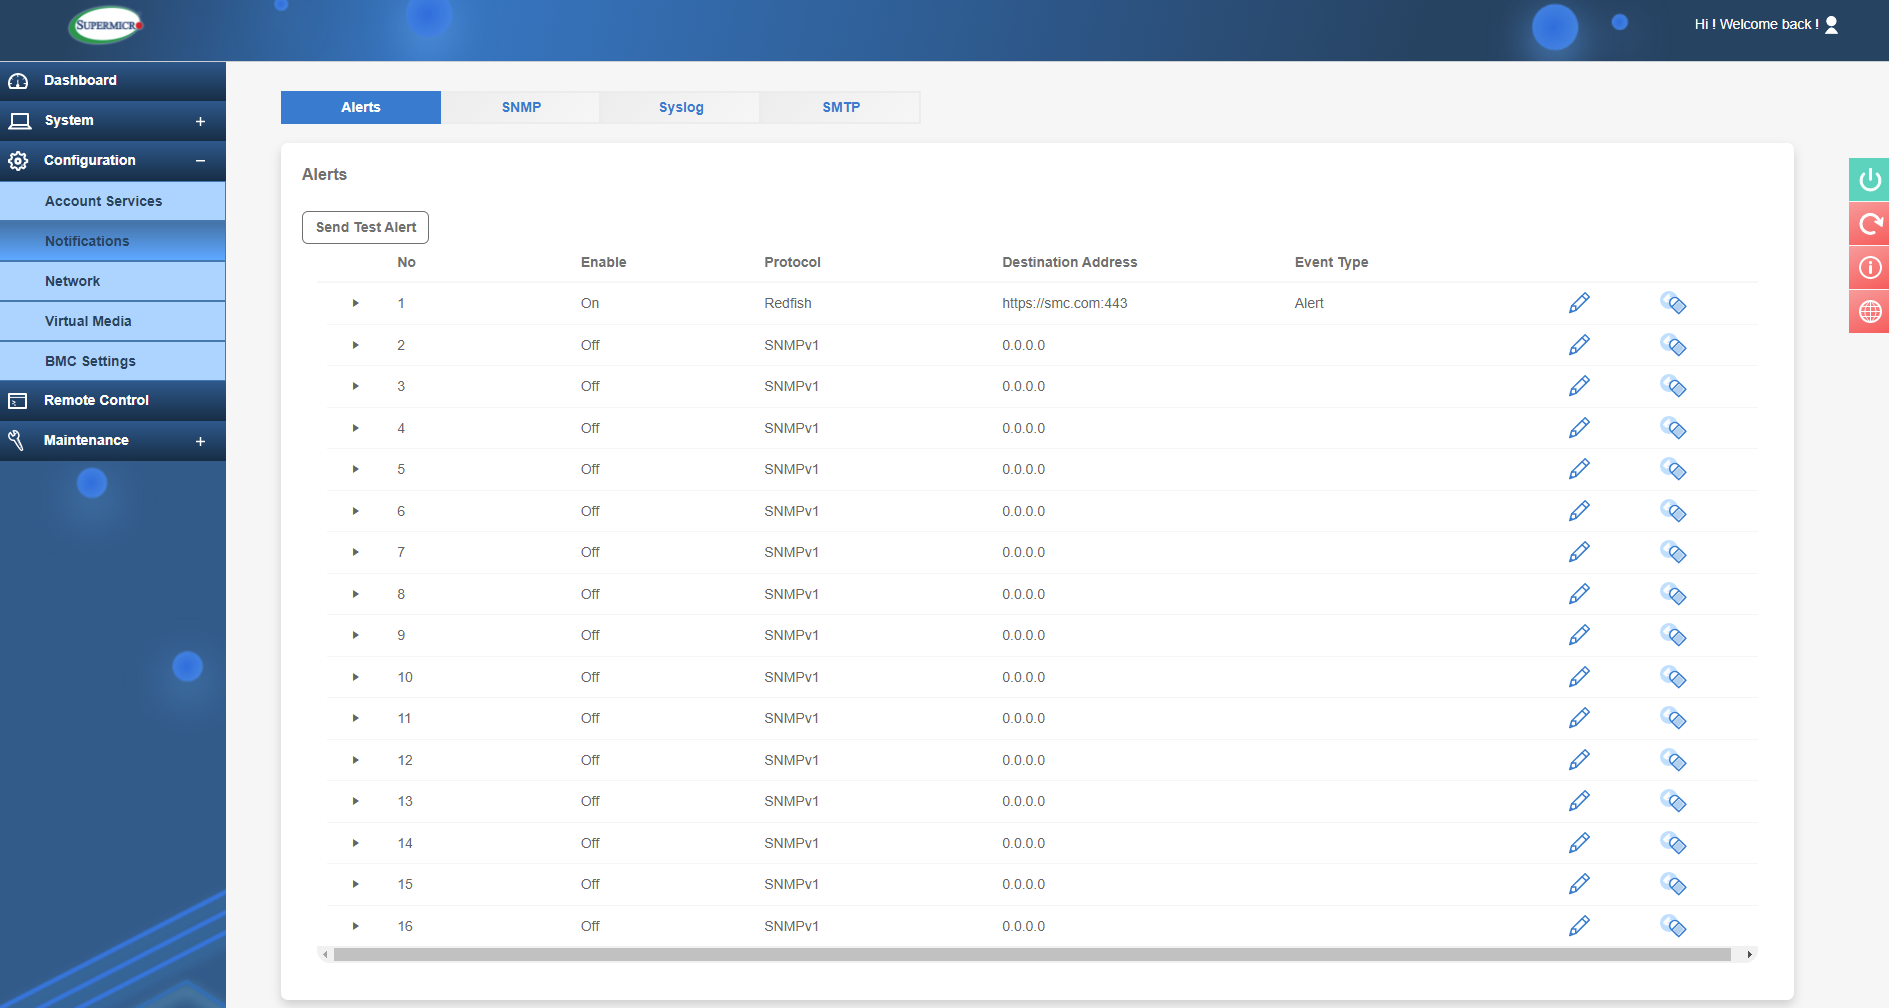
Alerts configuration
The next section under configuration is 'Network', and here we can configure the network settings for the IPMI connection. Setting a static IP is paramount for IPMI and here is where it can be configured, as well as in the BIOS as shown earlier. Here you can also set the Hostname for each server to differentiate them and connect to a VLAN if necessary. You can also specify what LAN port is to be used. For example, if you don’t want to connect a LAN cable to the dedicated IPMI port you can share the LAN1 connection for network traffic and IPMI. Don’t worry, the 2 are still separate as IPMI has its own MAC address so there will be no interference between the 2 connections. The other option is Failover, and this is where you may use the dedicated IPMI port but if it fails to connect during boot for any reason then IPMI will move over to LAN1.
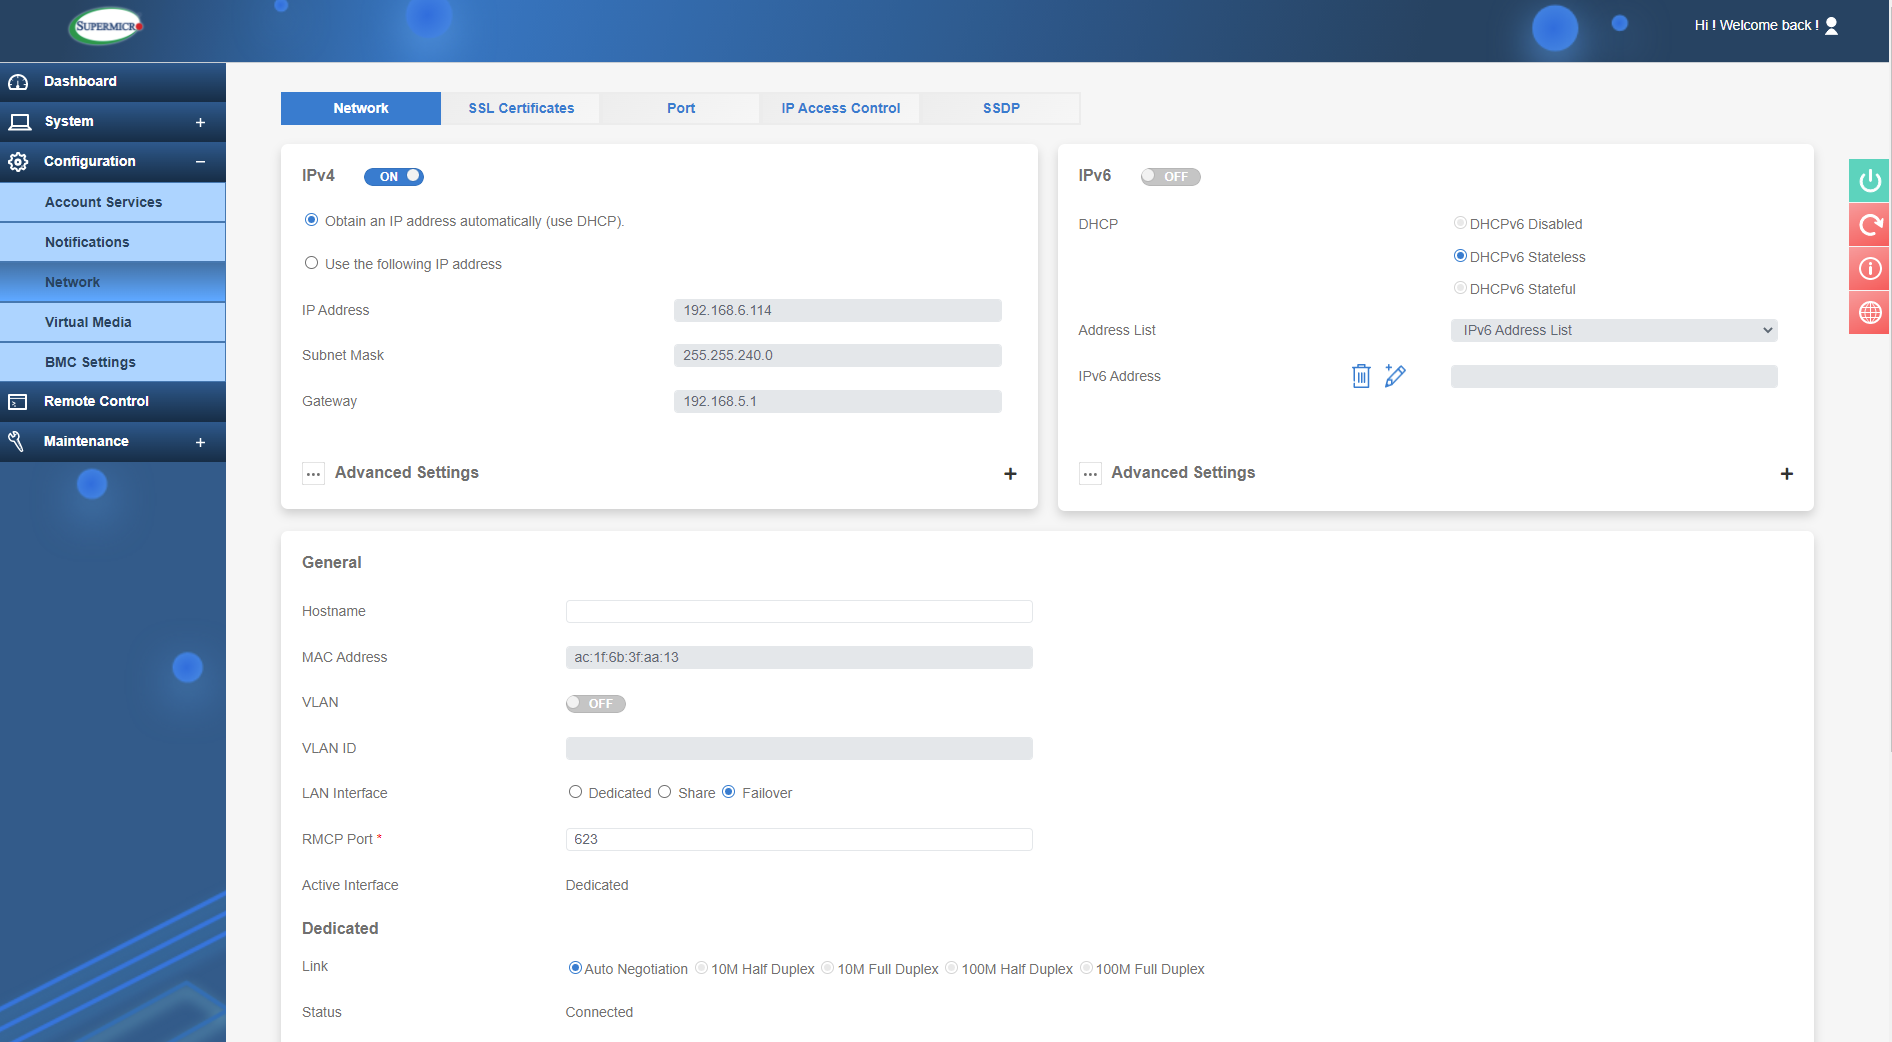
IPMI Network Configuration
Network ports can also be changed, to provide more security by using non defaults for protocols such as SSL, IKVM, SSH etc. This may help mitigate attacks on known ports. IP access can also be setup so that only certain IP addresses are able to access IPMI. Other security features have the ability to setup SSL Certificates with private keys to further restrict access and provide enhanced security. These are all important factors and each should be considered carefully, an intruder gaining access to IPMI would be disastrous for any server infrastructure.
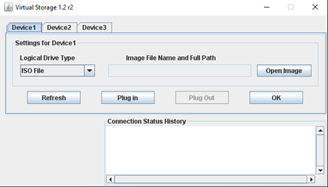
In the Virtual Media section, you can attach devices to use on the server such as a storage device or an .iso file to use as media for an OS install. In the below image you can see I have entered the path to an ISO stored on shared network storage. The following image then shows the ISO can be seen as a boot device (Virtual CDROM) by pressing F11 during POST. If I then boot from here, I can install an OS as if local media is attached to the server!
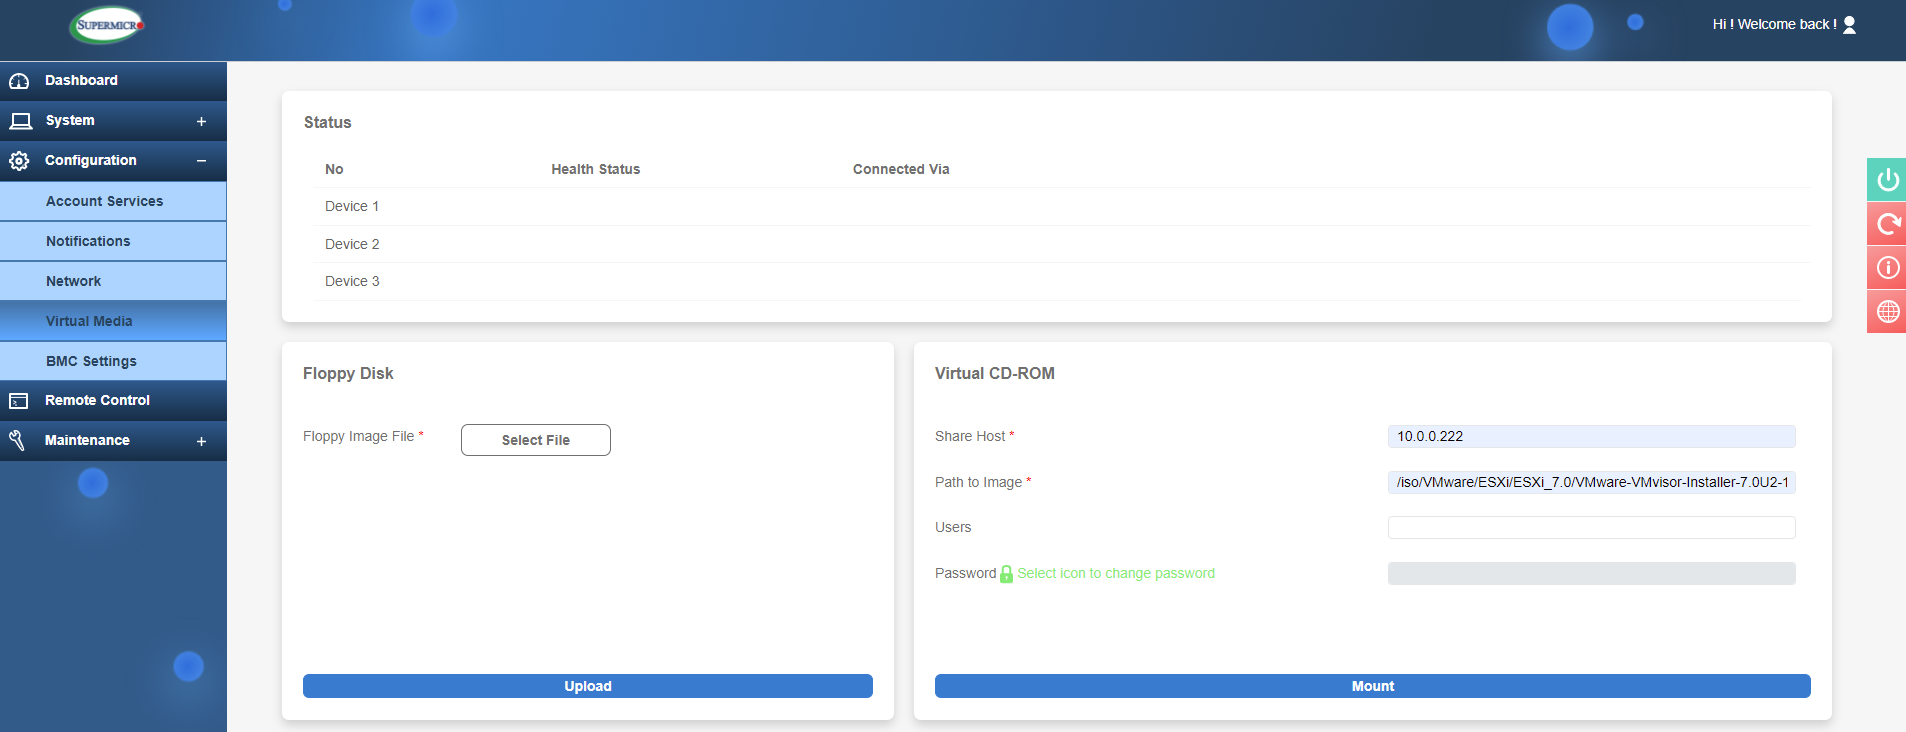
Attaching an ISO in Virtual Media
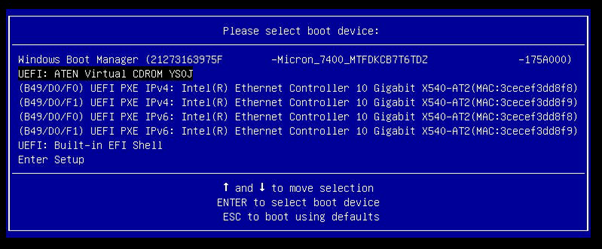
Attached ISO now shows in the boot chain
The final section in Configuration is BMC settings, and these relate to the BMC (Baseboard Management Controller i.e. the IPMI chip). Items of note here are Date and Time where you can use a NTP server to make sure the date/time is always in sync.
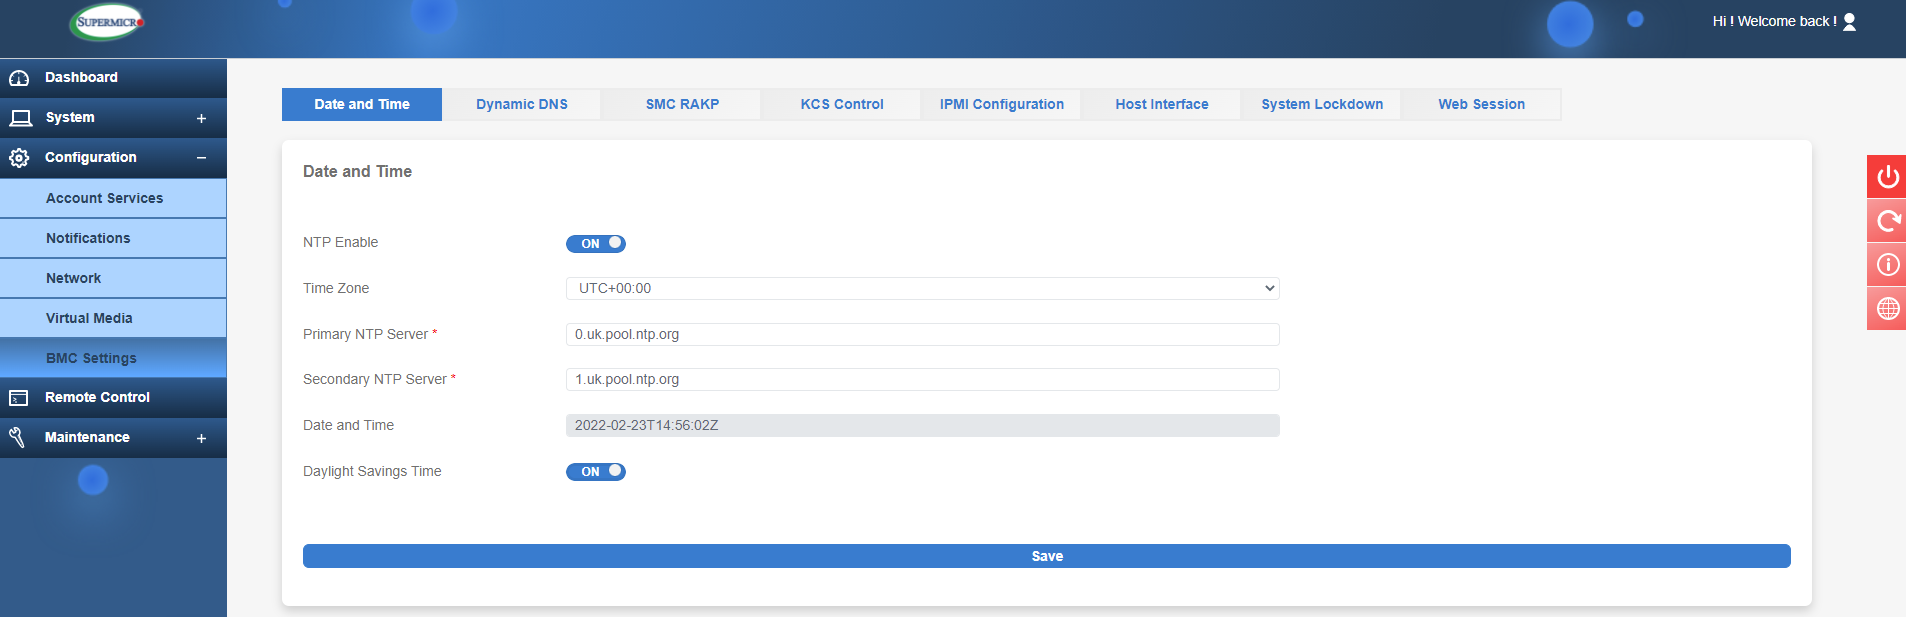
Using an NTP server for Date and Time
You can also save the current IPMI Configuration to a file for backup purposes, useful if you ever need to reset the BMC or if the motherboard is swapped out. In the Web Session you may also set the time it takes for the IPMI login to timeout after inactivity, a good security practise and is set to 30 minutes by default.
Remote Control
A great feature of IPMI is the ability to fully control the server as if you were sitting right in front of it. A powerful admin tool indeed!
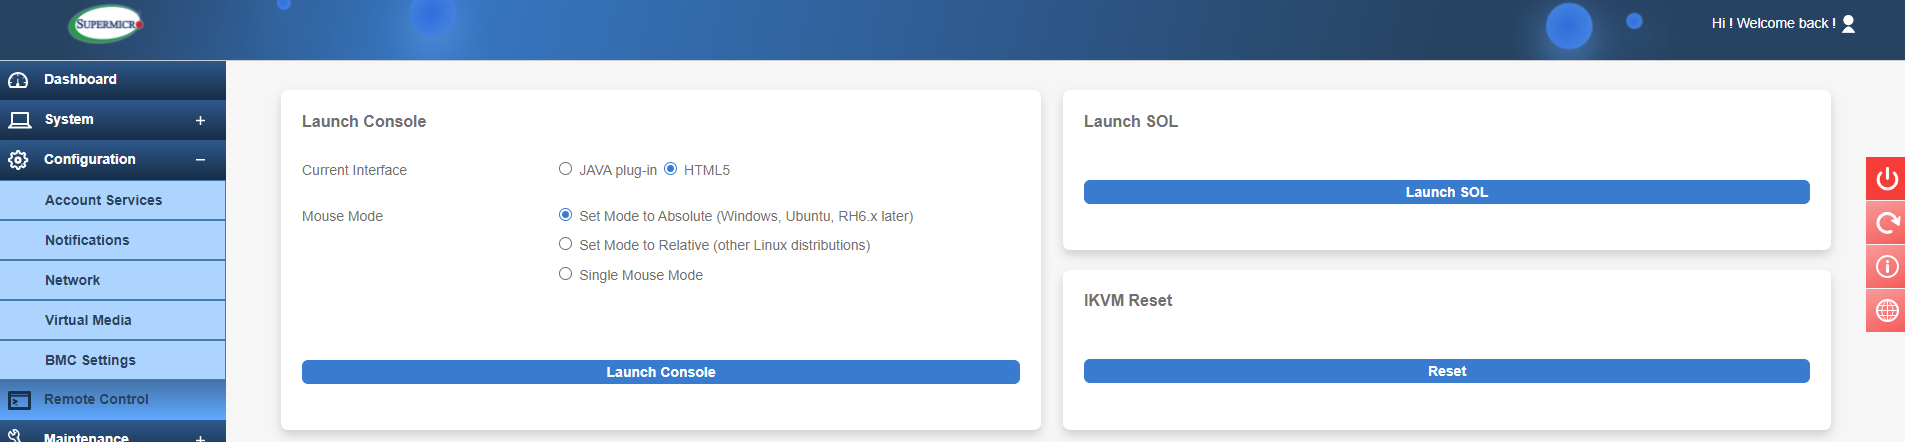
IPMI Remote Control Options
You can launch the console using Java or the newer HTML5 version. For a smoother experience I would recommend the newer HTML5 interface as it's less prone to issues and you do not have to install Java on your local machine as this may be a restriction for security purposes. There is a caveat with this, however, as the HTML5 console doesn’t support attaching virtual media by default. This requires a license upgrade from Supermicro, and we will talk more about license features in a future article.
The console is simply launched by pressing the Launch Console button for the selected interface. The Java console will require a small JNLP (Java Network Launching Protocol) file to be downloaded and run. Items to note here are Virtual Media where you can attach media much like in the web interface. So, you could attach a local ISO from your machine and install an OS that way, for example. Under Macro there are some useful shortcuts that you will need such as CTRL-ALT-DEL, if you need to send such input. In Preference you can set various display, input, and language options but I’ve never really felt the need to do much here. Power Control does what it says on the tin and is very useful to safely shut down (using Software Shutdown option), force a shutdown and power up etc.
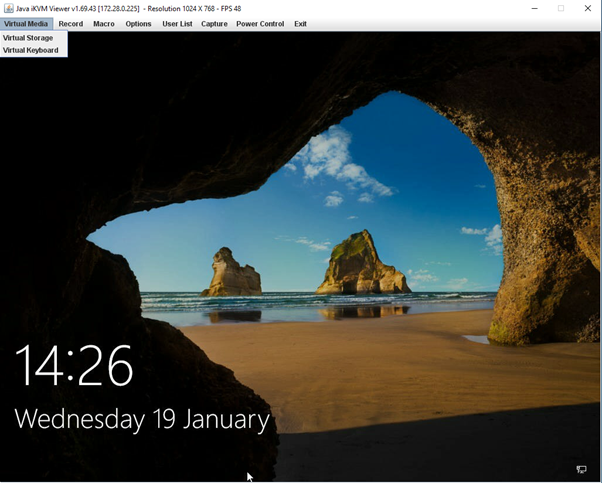
Java console with virtual storage selected
For the HTML console, it will simply launch in a new browser. It is more responsive and faster to launch so is the way to go for IPMI KVM. The options here are pretty much the same, just the lack of Virtual Media depending on your IPMI licensing.
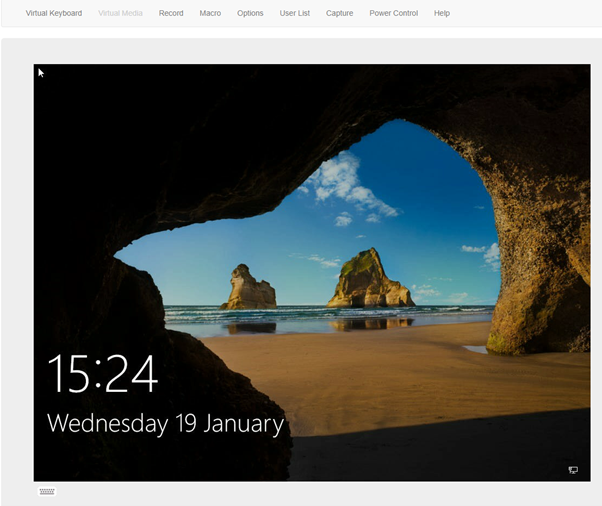
IPMI HTML5 console
Maintenance
The final section we will be looking at today is the Maintenance tab. Here is where we can update IPMI and BIOS firmware by downloading the relevant files.
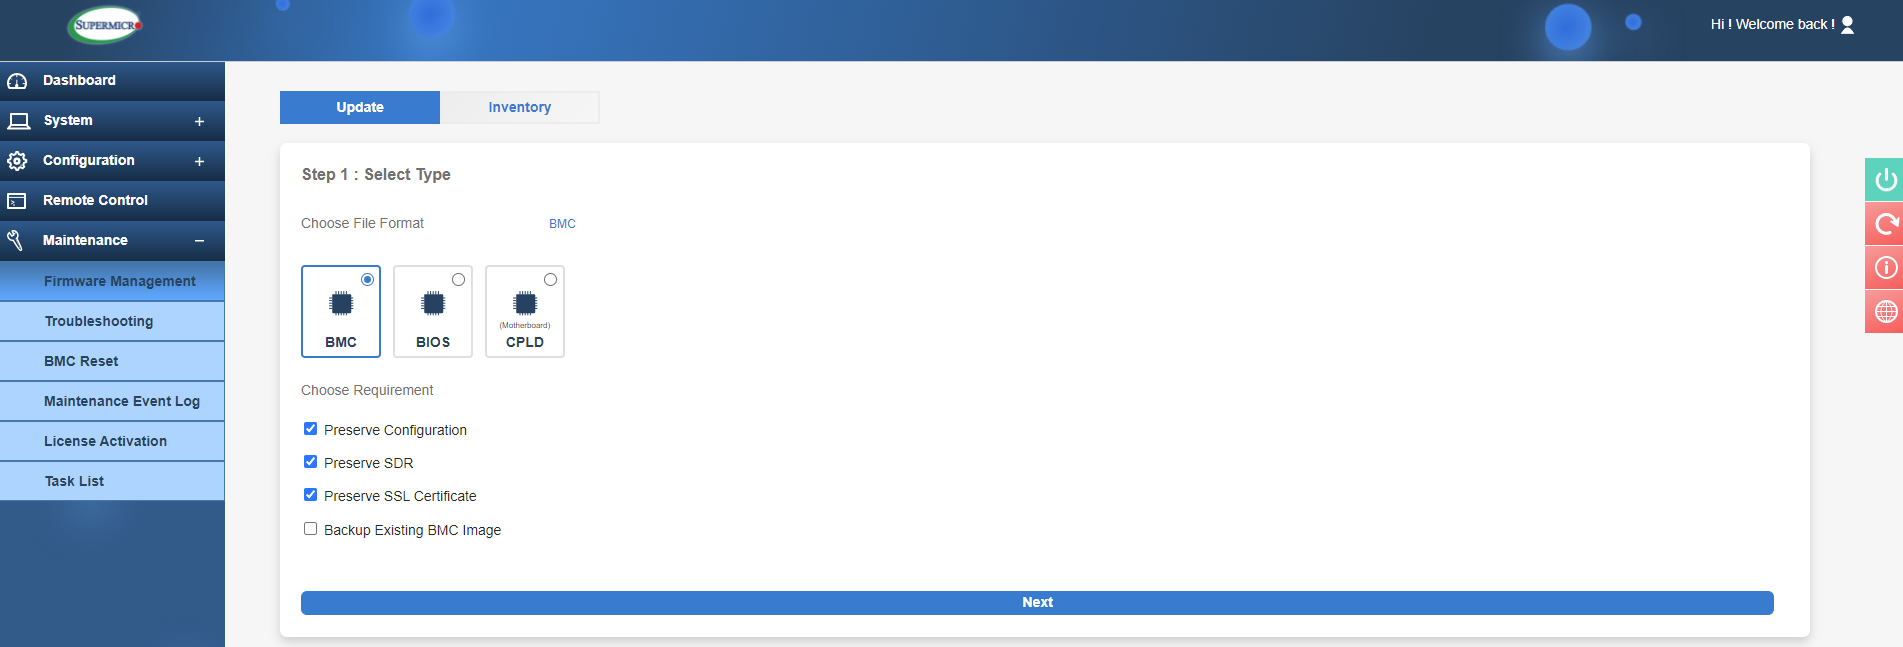
IPMI Maintenance tab Firmware Management
In this example I will show you how to update the IPMI BMC firmware. As you can see in the image above, the default option is to preserve the current IPMI settings, but you can deselect these if you wish. Typically, the settings can be preserved here. After hitting 'Next', you can select the firmware file (downloaded from the Supermicro website or obtained from your reseller) and press 'Upload'. Once it has finished uploading it will show the existing and new version to be installed.
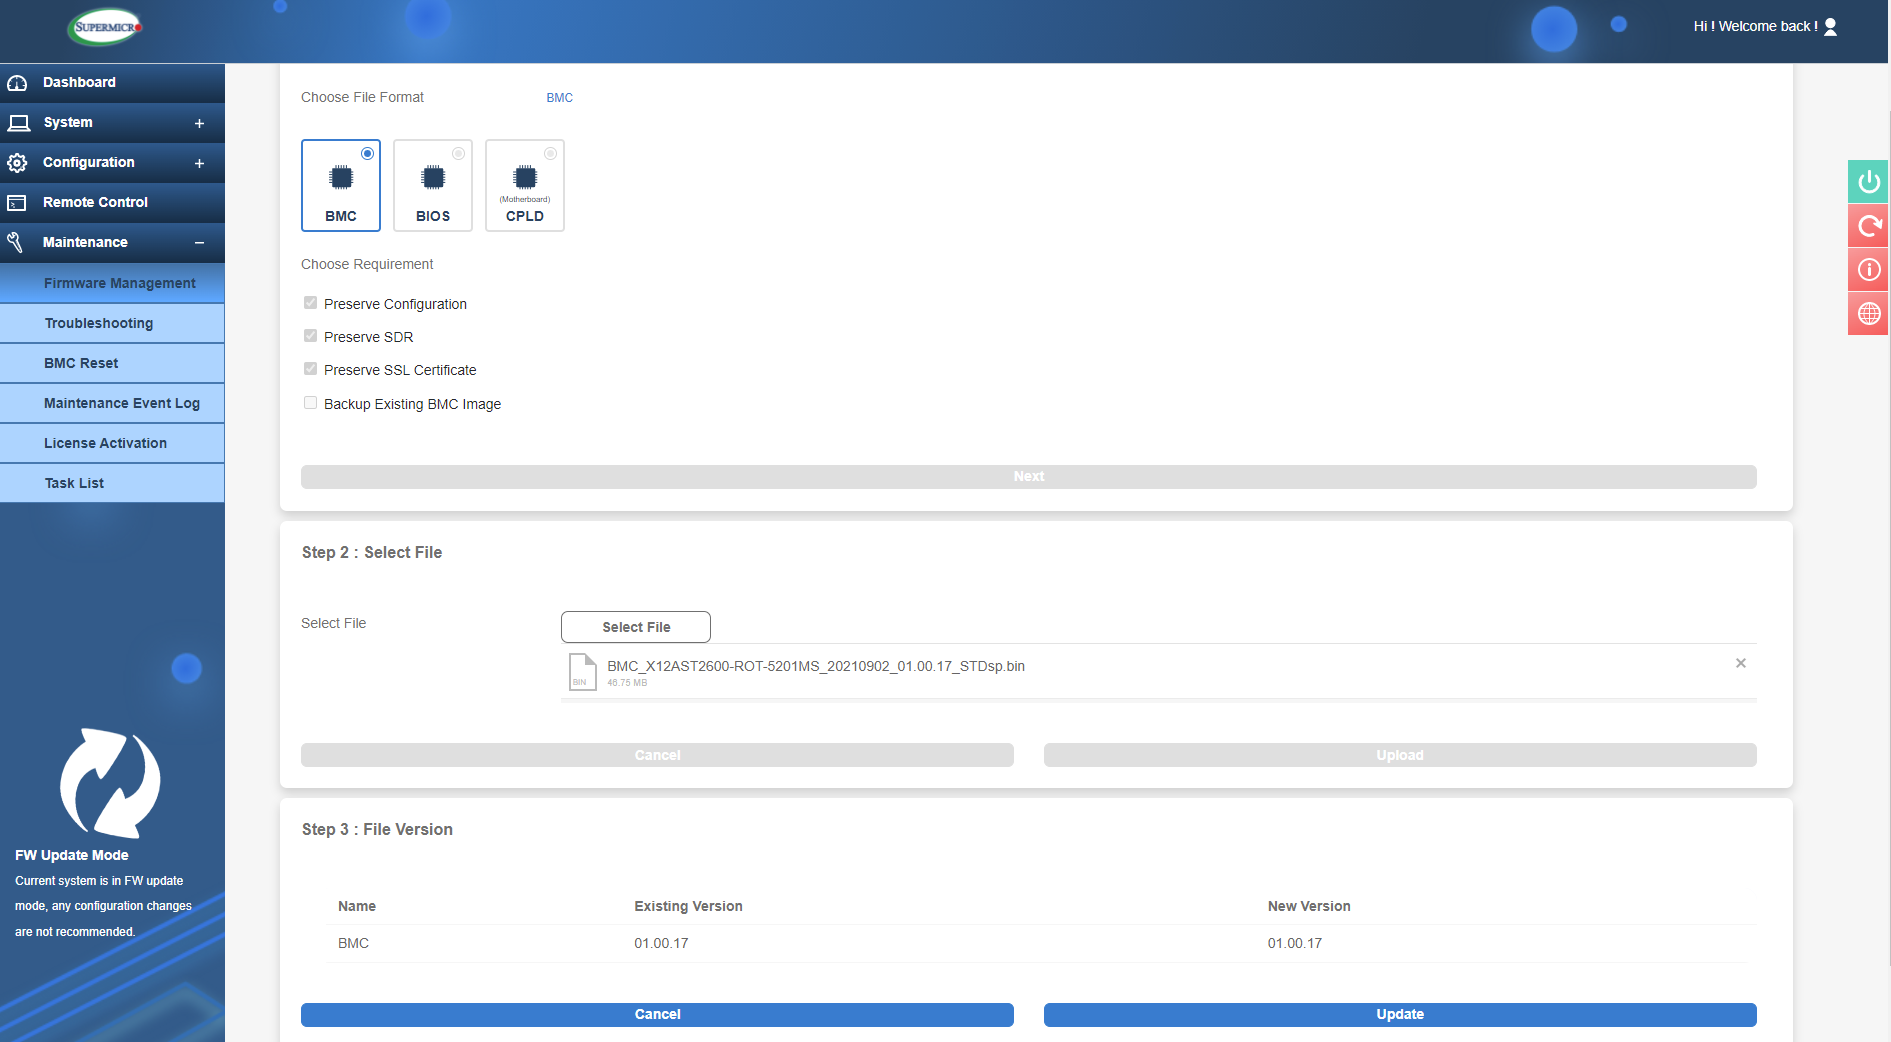
IPMI firmware update
You will notice in the bottom that IPMI is in ‘Firmware Update’ mode, so it is advised not to do anything else in IPMI at this time. After clicking update it will go ahead and start updating with a progress wheel informing you of the progress. Once it is done you can check the firmware version on the Dashboard, here we can see a successful update to 01.00.17:
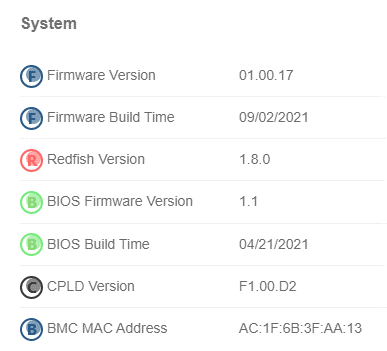
Dashboard showing the newer IPMI firmware
In the Troubleshooting section it's possible to obtain crash dumps if a server hangs or blue screens. These can be sent for analysis to Supermicro or your reseller to try and pin down any hardware issues.
BMC Reset is exactly as it sounds, if there's any issues with IPMI here is the place to reset it or even do a factory reset to fully wipe all existing settings. Therefore, it's advised that this would wipe everything and may change the IP address for the BMC controller.
The 'Maintenance Event Log' will show logs related to BMC interactions such as a web login attempt, firmware updates, power events and other settings/security related items.
As previously mentioned, IPMI does have certain functionalities only available with the relevant license(s). If one were to purchase a license, then the License Activation tab is where it can be applied. Once purchased, simply enter the key here to apply it to the servers BMC.
Conclusion
Hopefully, this has given you a good overview of the new IPMI interface and what you can do with it. It’s an especially useful tool for server admins as it allows a lot of control over the system remotely. But this is just the beginning, in future articles. We will take a look at the command line interface in which you can do everything we have shown today but without any GUI, as well as looking at other features such as storage management, server group management and licensing options.
Keep an eye out on our channels for part 2 of our 'How to' Supermicro IPMI series!
Written by:
Sukh Mander
Field Application Engineer